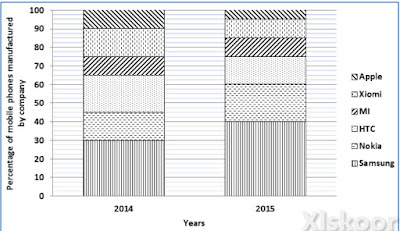
The stack chart given below shows the percentage distribution of the production of various models of mobiles by six mobile manufacturing companies in 2014 and 2015. The total production in 2014 was 35 lakh and in 2015 the production was 44 lakh. Study the chart and answer the following questions.
1.Total number of mobiles of Samsung, Nokia and Xiomi
manufactured in 2014 was?
(a) 2450000 (b) 22750000 (c) 2100000 (d) 1925000 (e) 225000
2. For which company the difference between number of
mobiles produced in 2014 and 2015 is maximum?
(a) Samsung (b) Nokia (c) HTC (d) Xiomi (e) None of these
(a) Samsung (b) Nokia (c) HTC (d) Xiomi (e) None of these
3. What was the difference in the number of Nokia mobiles
produced in 2014 and 2015?
(a) 355000 (b) 270000 (c) 225000 (d) 175000 (e) 200000
(a) 355000 (b) 270000 (c) 225000 (d) 175000 (e) 200000
4. What is the average number of mobiles manufactured by
companies Samsung and Xiomi taken both years together?
(a) 943750 (b) 943650 (c) 943760 (d) 943570 (e) None of these
(a) 943750 (b) 943650 (c) 943760 (d) 943570 (e) None of these
5. If 85% of MI mobiles produced in each year were sold by the
company, then how many MI mobiles remained unsold ?
(a) 76500 (b) 93500 (c) 118500 (d) 122500 (e) 96000
(a) 76500 (b) 93500 (c) 118500 (d) 122500 (e) 96000

